DOW + 124=12,294
SPX +11 = 1265
NAS + 19=2618
10 YR YLD +.08 = 2.03%
OIL +.33 = 99.86
GOLD + 1.60 = 1608.00
SILV unchanged = 29.23
PLAT +6.00 = 1425.00
SPX +11 = 1265
NAS + 19=2618
10 YR YLD +.08 = 2.03%
OIL +.33 = 99.86
GOLD + 1.60 = 1608.00
SILV unchanged = 29.23
PLAT +6.00 = 1425.00
Not much economic news to propel the markets into the holiday weekend. Lets cover the data points quickly:
Seasonally adjusted annual rate for sales of new single-family houses increased to 315,000 last month. The pace of sales is up 9.8% from the prior year. The median sales price fell to $214,100 in November from $222,600 in October.
Durable-goods orders rose 3.8% in November. For some reason, there was a huge surge in airplane orders. Go figure.
Personal income rose 0.1% in November, as consumer spending also gained 0.1%. At this pace we’ll see income get back to where we were in December 2007 in another 5 years, not counting inflation.
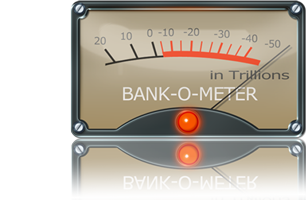
Yesterday we talked about the sweetheart deal the Departmetn of justice offered Bank of America to settle allegations of discrimination against 200,000 clients of Countrywide.
Yesterday we talked about the sweetheart deal the Departmetn of justice offered Bank of America to settle allegations of discrimination against 200,000 clients of Countrywide.
The American ideal of “equal and impartial justice under law” has repeatedly been undermined by attempts to concentrate power. Our political system has many advantages, but it also provides motive and opportunity for resourceful people to become so strong they can elude the legal constraints that bind others. The most obvious example is the oil and railroad trusts at the end of the nineteenth century. A version of the same process is happening again today but what has become concentrated is not a vital energy source or the nation’s transport arteries but rather something much more abstract: financial sector risk.
Now three years after the collapse of Lehman Brothers and the near global financial meltdown, the megabanks are even bigger, as is the risk they concentrate. And the fact that several of the megabanks are on still on the edge is actually one of the greatest shields they have against collapse; their sheer size serves as a get out of jail free card. They are so big and the potential threat of collapse is so frightening that our government is afraid to enforce financial fraud laws.
It is almost beyond comprehension that the government is too weak and feeble or possibly corrupted to enforce the law. And this failure of enforcement by the government has led to public protest and has deeply shaken the trust in the financial system.
No one is above the law, not presidents, not Robber Barons, not banksters. Whenever some group is above the law, equality before the law is dead. This is why the banksters are a threat to democracy.
And so Bank of America and Countrywide get off with a slap on the wrist. The penalty they pay will be deducted from their taxes, and they will likely receive a tax rebate, and if that’s not enough they will gouge merchants and customers with excessive fees. All because we don’t have the fortitude to stand up for equal justice, because it is easier and more expedient to neither admit nor deny wrongdoing. Well guess, what, it is wrong, it is unethical, and it is illegal to steal from someone, or in this case to steal from more than 200,000 someones because of their race or gender or some other perceived difference.
Our biggest banks pose a real threat; if you hold them accountable for their past actions, they will collapse. The only credible way to counter to this threat – and the only reasonable way to protect our democracy – is to break them up.
The time has come to stop cowering before the banksters and challenge them head on. What we need is the courage of Andrew Jackson when he told the bankers of his time:
“Gentlemen, I have had men watching you for a long time and I am convinced that you have used the funds of the bank to speculate in the breadstuffs of the country. When you won, you divided the profits amongst you, and when you lost, you charged it to the bank. You tell me that if I take the deposits from the bank and annul its charter I shall ruin ten thousand families. That may be true, gentlemen, but that is your sin! Should I let you go on you will ruin fifty thousand families, and that would be my sin! You are a den of vipers and thieves. I have determined to rout you out and by the eternal God, I will rout you out!”
And so, my wish this holiday season is the courage to change the things we can – and justice for all.
We have a couple of letters from the mailbag to kick off Open Phone Friday.
My comment is that I have found that investing 4% of my portfolio in the ETF GLD has produced an excellent hedge against currency and inflation risk. I have rebalanced my holding several times to maintain the 4% to accomodate gold's appreciation. I prefer this method to owning "physical gold". I believe you called it "paper gold" That has a negative sound to it and I believe it is unwarranted. I have had this holding for many years and have made a good profit. I thought I'd share this for your open line Friday.
Have a happy holiday!
Have a happy holiday!
Thank you and Happy Holiday to you.
I have said that ETF’s such as GLD are essentially paper gold. More specifically, it is a derivative of physical gold, another way to look at it is that you are getting a receipt for gold, and more specifically it is sometimes a receipt for an option on gold – so it’s a derivative of a derivative. It might even be backed by warehouse receipts, which is yet another deriviative; that isn’t a 100% accurate description because we can’t confirm that the ETF is actually acquiring physical gold on a dollar for dollar basis – but it’s not a bad description. And for a long time, people said, that shouldn’t be a problem. But for a long time I’ve been saying it might not be a problem but it could be a problem.
Then of course, I was proven correct. You guys know about MF Global. In the final days of MF Global's solvency, a huge chunk of supposedly protected client funds had vanished from its books. You know that MF customers are taking approximately a 28% haircut on their accounts, and many times much more – but a minimum 28% discount, even on accounts that held physical gold – even on accounts that supposedly held actual gold or silver bars, and they were issued warehouse receipts with the actual numbers of the bars.
A receipt is not the same thing as the physical item. Right now I have a receipt in my wallet for a shirt that I left at the dry cleaners. If all goes well, I can get my nice clean shirt from the dry cleaner, but if there is a problem I’ll get stuck with nothing to wear but a receipt – I could literally lose the shirt off my back.
So, you have to determine the time perspective for your trading and your risk tolerance. For short term trades, go ahead and use the ETF as a hedge. You clearly have experience and success with this strategy. You’re only using 4% of your portfolio, and if you lost it you could still survive. I don’t recommend physical gold for short-term trading. Likewise, I don’t recommend paper gold for the long-term purpose of wealthy preservation.
Here’s an idea- consider 3% for short term trades with paper gold, and consider 3% for longer term insurance with physical gold.
I really think that Gold and Silver have peaked big time !!!
I sit around and study stock graphs all day. I could be
wrong, but that is what it is looking like to me.
I just thought that I would pass it along for whatever
it is worth !!!
I am so glad that you are back on the radio !!!
I sit around and study stock graphs all day. I could be
wrong, but that is what it is looking like to me.
I just thought that I would pass it along for whatever
it is worth !!!
I am so glad that you are back on the radio !!!
You might be right. Gold might have peaked. Let’s examine this a bit further.
First, let’s look at some fundamentals. The recent decline was sparked by several issues: the MF Global fallout, a rising dollar, year-end tax-loss selling, and the need for cash and liquidity to meet margin calls or redemption requests. I believe these issues are short-term. If you are trading gold short-term then you certainly had fundamental reasons to sell.
What about the longer-term outlook? Have the reasons for gold's bull market changed in any material way such that we should consider exiting? Are the sovereign debt problems in Europe solved? How will the US repay its $15 trillion debt load without some level of currency dilution? Is there likely to be more money printing in the future, or less? Are real interest rates positive yet? Has gold really lost its safe haven status as a result of one bad week? Has demand for precious metals increased (and don’t forget a couple of billion people in India and China)? Has supply increased along with demand?
I would argue that the fundamentals for gold point to substantially higher prices over the long term, but don’t be surprised to have some volatility along the way.
Now let’s look at the charts:
The recent drop equals 12.5%. This isn't to suggest that the correction is over, but it does show that we've already matched the average decline, which is also 12.5%. This comes on the heels of the 15.6% fall in September. You'll notice something else: We've now had three major corrections (greater than 5%) in one year, the first time that's happened in this bull market. And this is probably what has you worried.
The worst-case scenario would be a drop that matched the biggest on record, 27.7% from $1,795. We’ve seen a couple of drops of 27% - back in 2006 and again in 2008. But what happens after each drop? The price comes roaring back. You’ve got to know the item you are trading. Different sectors of stocks trade differently than other sectors, and any individual stock may trade slightly differently from another – even within the same sector. Then you have further differences depending upon your time frame. The market is much more volatile over the past 10 years than it was in the 1990’s; this just makes sense. Gold has been on a mega bull market run for the past ten years; I think it is reasonable to expect bigger and more severe pullbacks in light of a super strong bull market.
If you look at the ten-year chart, the bull market still looks very much in place. If you look at a quarterly chart, you will probably see a reversal pattern with a long upside wick. If you look at a shorter-term chart, we broke support levels from late September and October. For the short term trader – trading in ETF’s for example, you could have exited the position a couple of weeks ago, and there were some indicators that might have gotten you out, and I mentioned that possibility, when prices took out the lows of November. For longer – term, the dip looks like a buying opportunity. And I would say that is even more true of silver.
The volatility in the silver market offers much faster and stronger moves for aggressive traders. Remember that volatility can be your friend when you are trading, but it can give you a stomach ache if you are holding for the longer-term, or it can give you buying opportunities. Remember 2008, when silver drop about 54%. I certainly couldn’t blame you if you sold at around $18 dollars an ounce, or even if you sold at $14 an ounce. You were a genius if you bought at $9. And if you bought at $12 an ounce, you’re still feeling pretty good.
In fact it looks a lot like 2008. In a time of crisis, all speculative positions get hit; traders move to cash and cover margin calls, of course back then the US stock markets were getting clobbered. Fast forward to today, and the S&P 500 is flatter than a pancake – it just sneaked into positive territory for the year to date – not exactly a crash – (just a reminder that gold is up more than $200 year to date) But then look overseas; the German DAX is down about 25%, the French CAC 40 is down 27-28%. So, it’s not surprising that we’re seeing volatility that looks a lot like 2008. I’m just saying – we’ve been there before, this time we have subtitles.
Remember one of the first rules of technical analysis: a trend in place is more likely to remain in place than it is to reverse – until it reverses.
When will you know the trend has reversed? Well after the fact. Will you be able to sell at the top? Probably not.
Crazy economic number:
#1 A staggering 48 percent of all Americans are either considered to be "low income" or are living in poverty.
#2 Approximately 57 percent of all children in the United States are living in homes that are either considered to be "low income" or impoverished.
#6 There are fewer payroll jobs in the United States today than there were back in 2000 even though we have added 30 million extra people to the population since then.
#7 Since December 2007, median household income in the United States has declined by a total of 6.8% once you account for inflation.
#8 According to the Bureau of Labor Statistics, 16.6 million Americans were self-employed back in December 2006. Today, that number has shrunk to 14.5 million.
#15 According to a recent study conducted by the BlackRock Investment Institute, the ratio of household debt to personal income in the United States is now 154 percent
#24 Electricity bills in the United States have risen faster than the overall rate of inflation for five years in a row. [Is it transitory, Ben?]
#43 A staggering 48.5% of all Americans live in a household that receives some form of government benefits. Back in 1983, that number was below 30 percent.
No comments:
Post a Comment
Note: Only a member of this blog may post a comment.